Have you ever heard of data patterns? If you’re working in the field of data analysis or data science, understanding data patterns is essential. In this article, we’ll delve into the basics of data patterns, why they are important, and how you can effectively analyze and interpret them.
What are Data Patterns?
Data patterns refer to trends, relationships, and structures that can be found in a dataset. These patterns can provide valuable information and help us to make the right choices. You can identify anomalies, anticipate results and optimize processes by analysing patterns of data.
Why are Data Patterns Important?
There are several reasons for its importance. First, they’ll give you a better understanding of the data you’re working with. Hidden relationships can be discovered and valuable information gained through the recognition of patterns. Second, it can help to identify outliers or anomalies which may require investigation in the future. Finally, you can make more accurate forecasts and improve decision making by analysing the data patterns.
How to analyze data patterns
There are a number of steps involved in its analysis. To ensure accuracy, the data need to be collected and cleaned first. You can begin to explore and visualize the data in order to find possible patterns once you’ve collected your own clear data. Various techniques such as clustering, regression and time series analysis may be used for this purpose. To make informed decisions, you will be able to interpret the patterns which have been identified and apply them.
Types
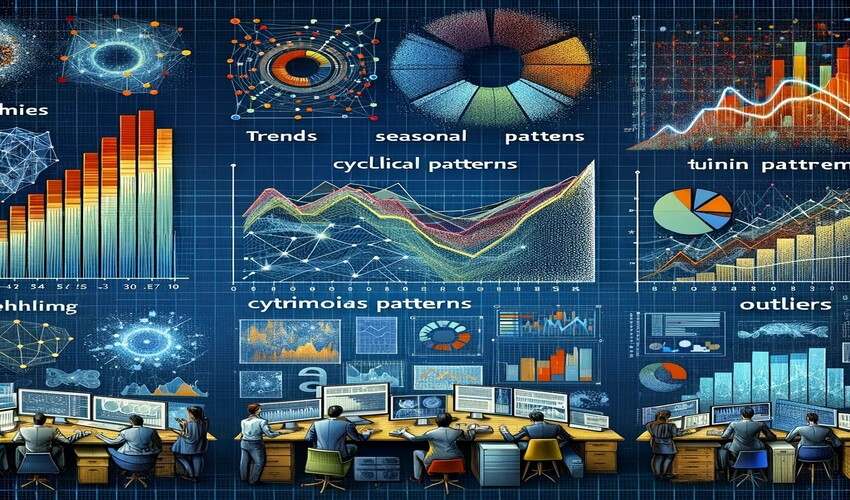
- Trends: Long-term movements in data that show a general direction over time. For example, an upward trend in sales data indicates growing business performance.
- Seasonal Patterns: Recurring patterns that occur at regular intervals, such as increased retail sales during the holiday season.
- Cyclical Patterns: Fluctuations that occur over longer periods due to economic or business cycles, like the boom and bust cycles in the economy.
- Random Patterns: Irregular data points that do not follow a discernible pattern, often caused by unpredictable factors.
- Outliers: Data points that deviate significantly from other observations, indicating potential errors or unique events.
Techniques for Identifying
- Statistical Analysis: Using statistical methods to identify and quantify patterns within data.
- Data Visualization: Graphical representation of data, such as line graphs, bar charts, and scatter plots, to visually identify patterns.
- Machine Learning: Employing algorithms to detect complex patterns and make predictions based on data.
- Time Series Analysis: Analyzing data points collected or recorded at specific time intervals to identify trends and seasonal effects.
- Clustering: Grouping data points with similar characteristics to identify underlying patterns within the data.
Applications
- Business Intelligence: Understanding customer behavior, market trends, and operational efficiency through data patterns.
- Healthcare: Identifying disease outbreaks, predicting patient outcomes, and optimizing treatment plans.
- Finance: Detecting fraud, analyzing market trends, and managing risk.
- Retail: Optimizing inventory, improving customer experience, and increasing sales through pattern analysis.
- Manufacturing: Enhancing quality control, predicting maintenance needs, and improving production efficiency.
Challenges in Identifying Data Patterns
- Data Quality: Ensuring data accuracy and consistency is crucial for reliable pattern detection.
- Volume and Complexity: Handling large and complex datasets requires robust data analytical tools and techniques.
- Interpretation: Correctly interpreting patterns to derive meaningful insights can be challenging and requires expertise.
Wrap Up
In order to leverage the full potential of data in different areas, it is important to understand patterns. Organisations can make better decisions, anticipate future outcomes and improve their total performance through the identification of trends, anomalies or relations. For businesses and researchers, learning the basics of data pattern analysis will become even more essential as information grows in volume and complexity.


Leave a Reply